Clutch Stories — AI-powered fantasy football storytelling
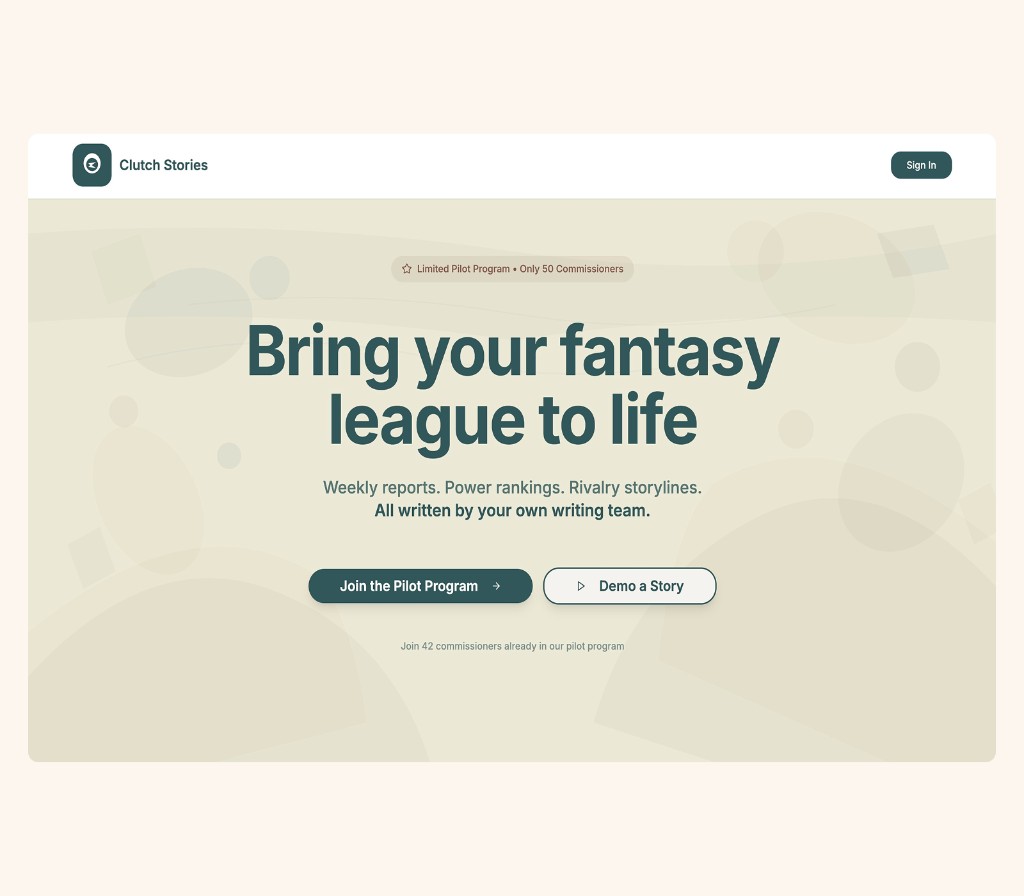
Fantasy leagues generate drama all season, but almost none of it gets documented—just a standings table and fading memories. Clutch Stories turns scores and matchups into weekly narratives commissioners can share, with tone you choose before a word is generated.
The gap
Engagement spikes on draft day and game days, then drops mid-week. The memorable beats—the comeback, the rivalry, the chaos waiver run—don’t live anywhere permanent. The constraint wasn’t access to data; it was narrative.
Clutch Stories is built as a storytelling surface first: ingest league truth (scores, standings, results), export stories people actually read.
Who it’s for
- Players who want more than boxes scores—a reason to stay in the group chat between Sundays.
- Commissioners juggling 10–12 people for 17+ weeks who need help carrying community energy.
- Sports fans who enjoy creative angles on games they already follow.
My role
Full 0 → 1 ownership: PRD and success framing, UX/UI in Figma, scaffold in Lovable, production interaction and integration work in Cursor with Claude Code, persistence via Supabase. The stack was deliberately fast for v1—scaffold quickly, refine where craft shows.
How I framed the product
- Engagement: story read-through and return visits—not vanity clicks.
- MVP input: matchup scores as the minimum viable spine; richer inputs additive.
- Personalization without blank-page anxiety: a structured tone step (funny, dramatic, analytical, professional) shapes AI output before generation.
Information architecture
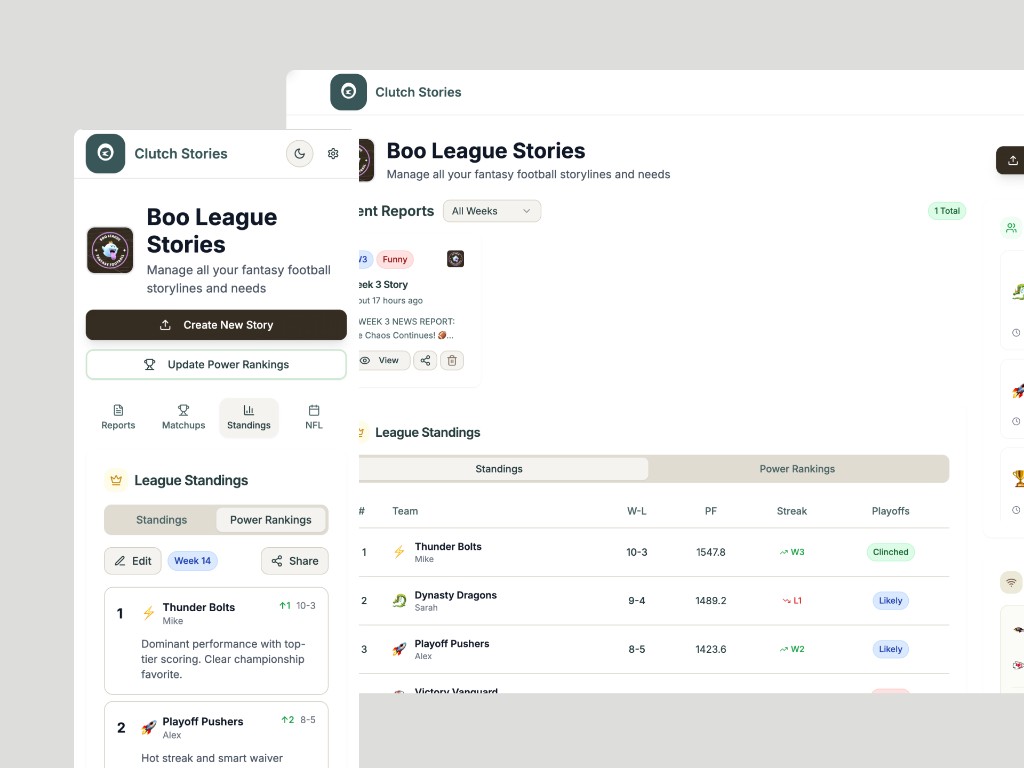
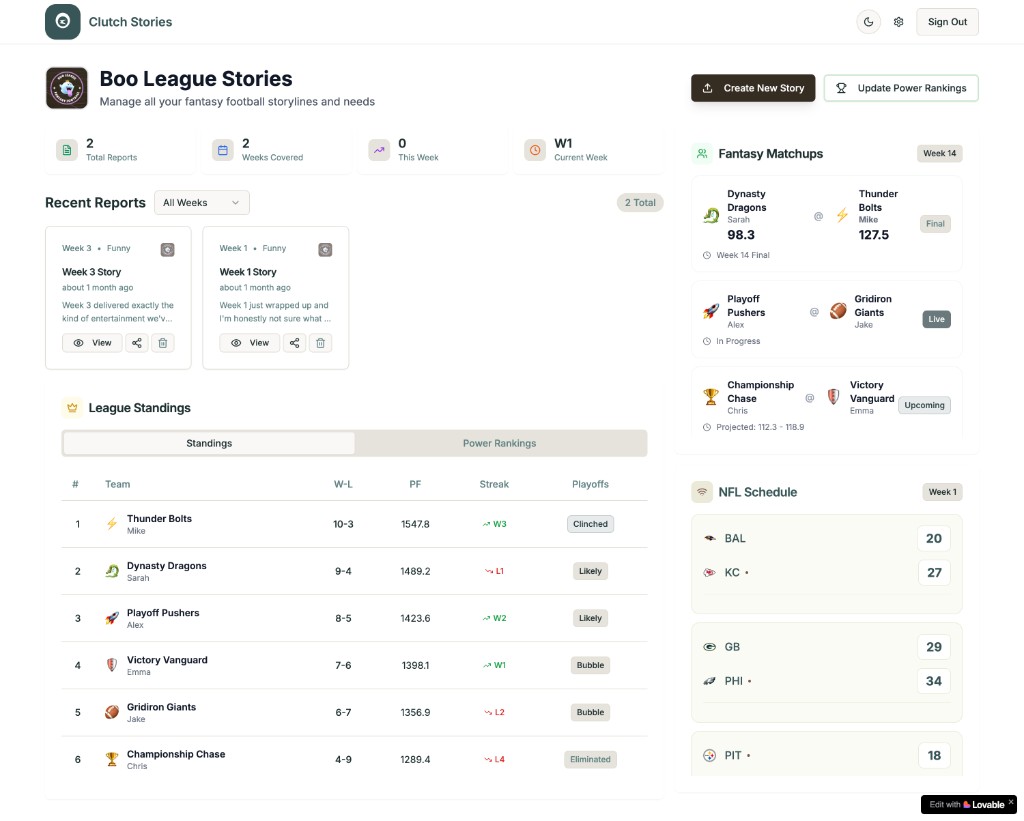
Two mental models had to coexist: the commissioner managing stories and rankings, and the member who mostly reads and shares. The dashboard leads with recent stories and standings—shared priorities—while creation sits in clear secondary actions (Create New Story, Update Power Rankings).
Visual language
- Color: deep forest green on warm cream—editorial, not default sports-app red/blue.
- Type: legible UI fonts for dense tables; expressive script in the brand mark for “Stories.”
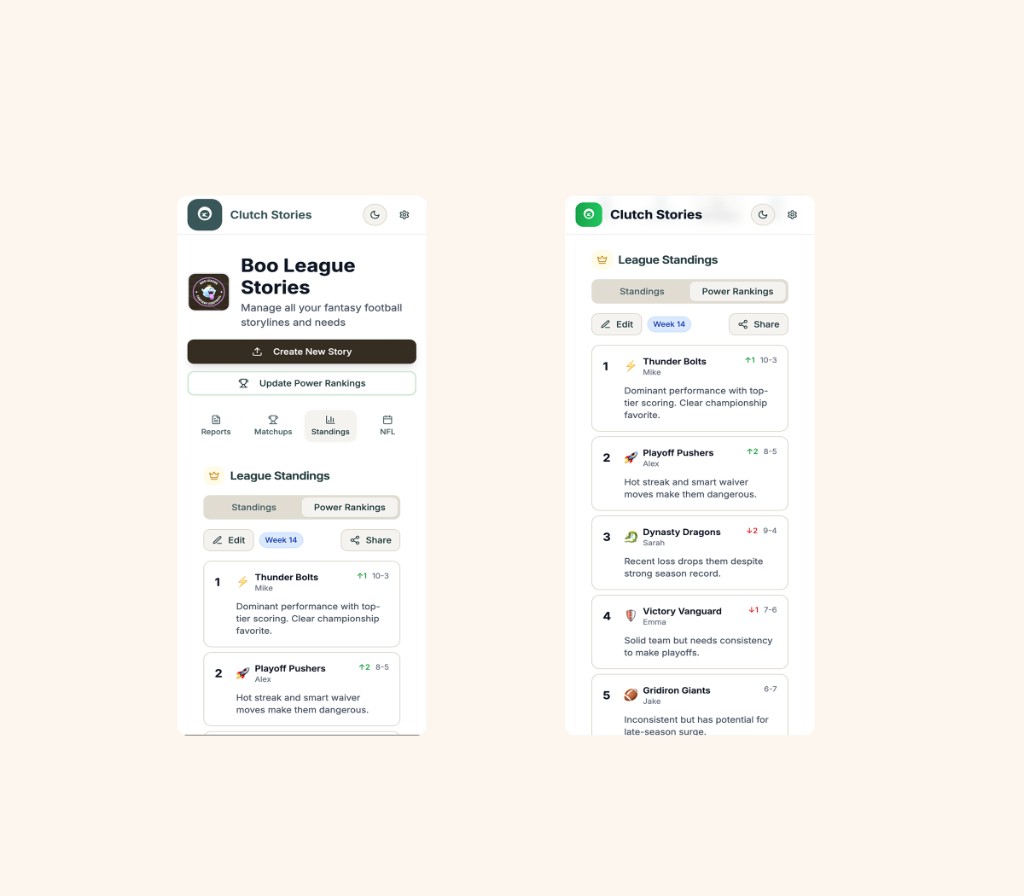
- Density: generous spacing on mobile; desktop reveals fuller standings columns (PF, streak, playoff status).
- Tone chips on story cards prime readers before they open a narrative.

Dashboard
Command center for league identity, snapshot stats, recent stories with tone tags, standings, fantasy matchups in a right rail, and NFL schedule for real-world anchoring. Desktop rails separate your league from league context to reduce overload.
Story creation
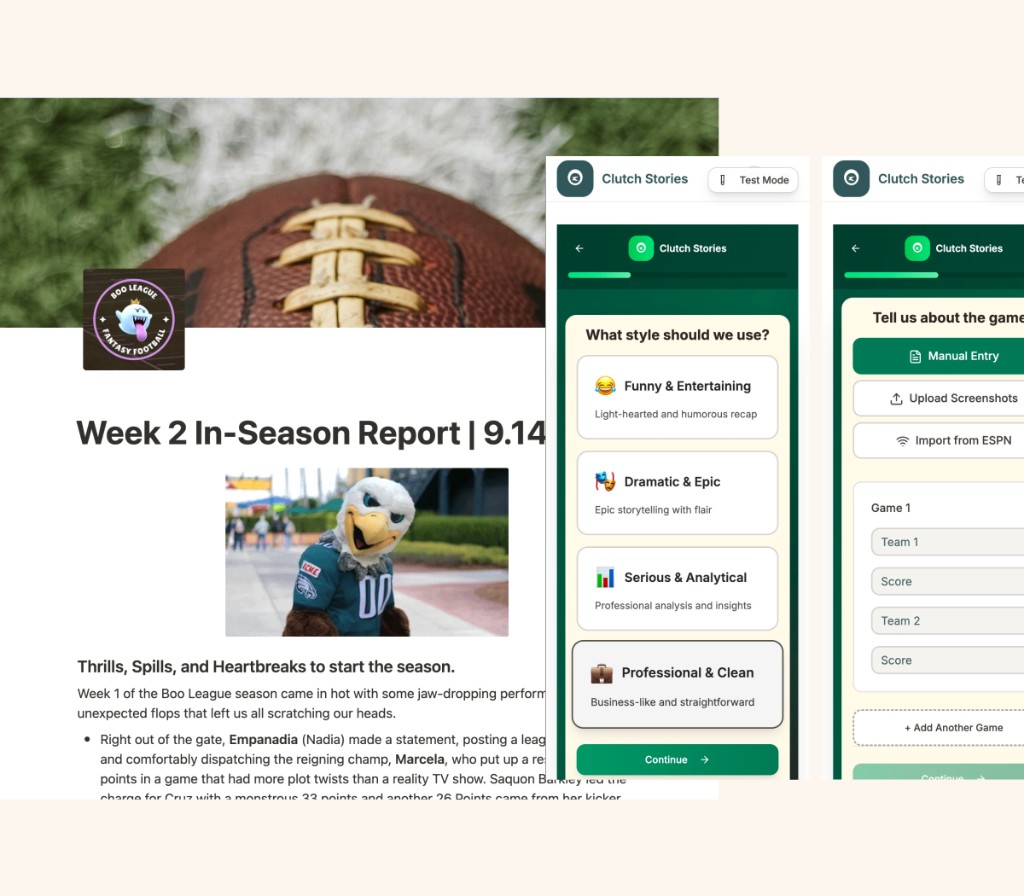
Three beats: pick tone, enter data (manual first—screenshots or ESPN import when available), generate and review. The tone step is the personalization unlock—same box score, totally different voice.
Standings & power rankings
Tabbed standings vs. power rankings for leagues where record alone lies. Team rows carry streak and playoff signals so the table reads closer to commentary than a CSV export.
What shipped
- Multi-tone story generation from league data
- League dashboard — reports, standings, matchups
- Commissioner power rankings with editorial blurbs
- Story management — view, share, delete, filter by week
- Responsive mobile and desktop layouts
- Test mode for demos without live league data
Results & reflections
Live with real leagues—including mine. The consistent reaction is delight when people see their teams and results in narrative form: curiosity flipping to “it’s actually about us.”
Lesson: ESPN-style import is seductive for users but messy in practice; manual entry as the primary MVP path was right—import as stretch.
Proof: one designer can close the gap to shipped software with modern scaffolding plus disciplined refinement—not a throwaway prototype.
Roadmap: ESPN league sync, shareable story links, public league feed—in progress for the next season.
Artifacts
- PRD · IA map · Figma component library · Responsive layouts · Brand system · Shipped web app